
Our web app · staff and clients sign in here
Project Monitoring Dashboard
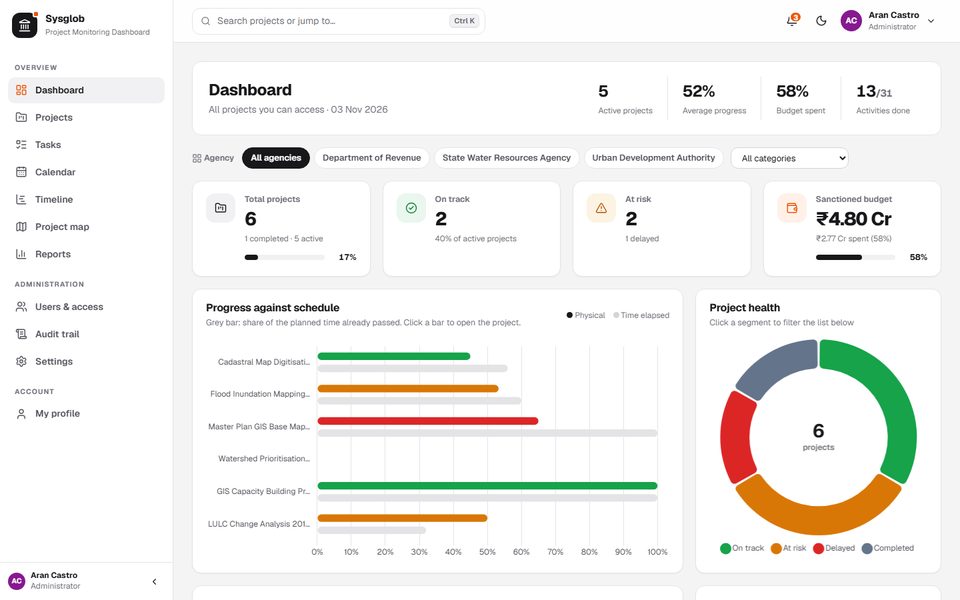
Where SysGlob and Geospatial Campus run their work, and where our clients follow their projects: progress against schedule, budget and spending, milestones and risks on a map, payments, training, meetings and chat, each person seeing only their part. It runs in the browser and as an Android app.
Sign in to the dashboardTry the demoAsk about it for your organisation
What is in it
8 parts, one sign-inProjects and milestones
Progress against schedule, milestones with payment stages, risks, documents and photos, with each project on a map.
Budget and spending
Sanctioned budget against expenditure, expense claims with bills, and what is due from each client.
Payments
Ask to be paid with your UPI QR code, monthly subscriptions with reminders, and money received and given, kept the same on both sides.
Training
Batches, students with joining dates, QR check-in, class attendance by batch and by student as charts or tables, and certificates.
Meetings and calls
Agenda and minutes, action points as tasks, and video calls in the browser that outside guests join with an invitation link.
Team chat
One-to-one and group chats with photos and files, and an AI assistant when asked.
Academic research
Research from planning to publication, with the team, scholars, submissions, files and consultation.
Reports and the phone app
Reports for clients, Excel exports, notifications on the phone, and an Android app.
Each person sees their part
One app, with access set by role. A client agency never sees another client's project, internal notes or our costs.
- Administrators. Everything: projects, people, money, training and reports.
- Project managers. Their projects, milestones, risks, documents and team.
- Client agencies. Only the projects shared with them, and the reports we choose to share.
- Trainers and campus heads. Batches, students, class attendance and certificates.
- Interns and scholars. Their tasks, their research and what is shared with them.
Click through it on sample data.
The demo is the dashboard itself on sample projects, students and payments, running in your browser: open every page as each role; nothing you change is saved. Ask us for the demo sign-in.